
–Andrew Karp


Source: 2018 Premium Lens MarketPulse Survey
Source: 2018 Premium Lens MarketPulse Survey
Source: 2018 Premium Lens MarketPulse Survey
Source: 2018 Premium Lens MarketPulse Survey
Source: 2018 Premium Lens MarketPulse Survey
Source: 2018 Premium Lens MarketPulse Survey
Source: 2018 Premium Lens MarketPulse Survey
Source: 2018 Premium Lens MarketPulse Survey
Source: 2018 Premium Lens MarketPulse Survey
Source: 2018 Premium Lens MarketPulse Survey
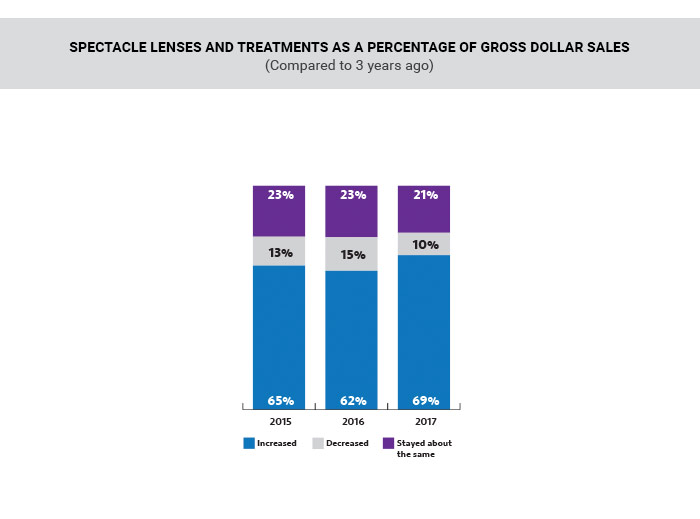
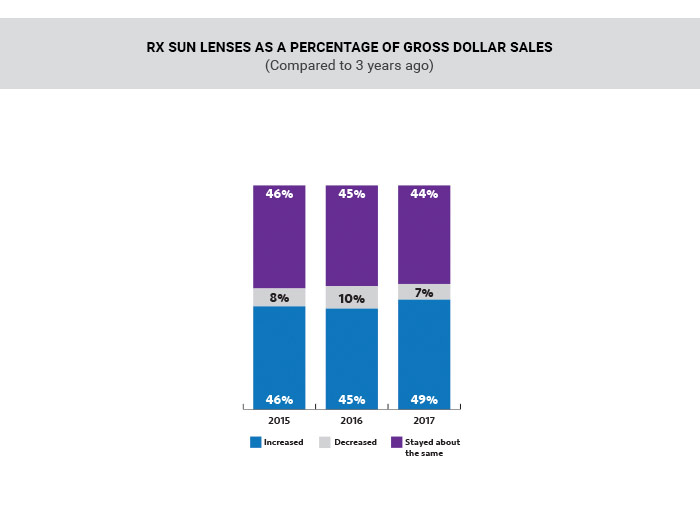
TOTAL SALES
Compared to three years ago, 69 percent of retailers said that spectacle lenses and treatments made up a larger percentage of their location’s total gross dollar sales in 2017. In 2017, 54 percent said pricing on spectacle lenses and treatments has increased compared to three years ago as well, and 49 percent said that Rx sun lenses as a percentage of total dollar sales increased over the same period.
LENS SALES
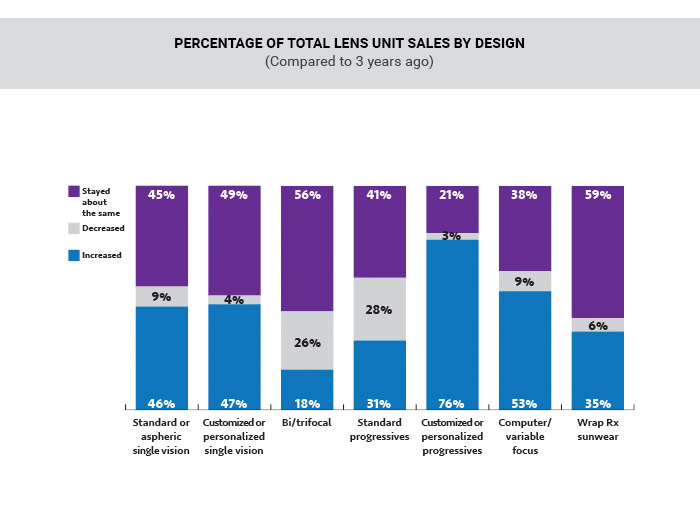
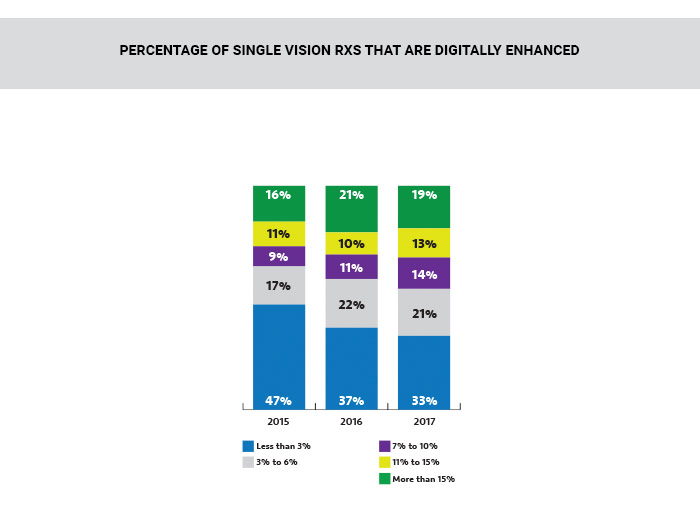
When asked to rank lens design by popularity, standard or aspheric single vision was ranked most popular by 56 percent of retailers. Customized or personalized progressives were ranked most popular by 30 percent, and standard progressives were ranked most popular by 10 percent. One-third of retailers (33 percent) said ess than 3 percent of single vision Rxs sold are digitally enhanced.
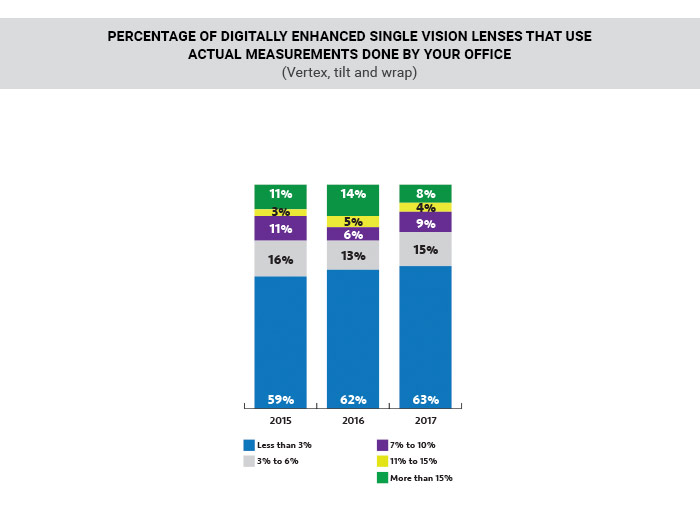
Sixty-three percent of retailers said less than 3 percent of single vision digitally enhanced lenses use actual vertex, tilts and wrap measurements done in the office by the retailer.
More than three quarters (76 percent) of retailers said that customized or personalized progressives lenses made up a greater proportion of their total lens sales in 2017 than they had versus three years ago, and 53 percent said computer/variable focus sales had increased over the last three years, while 41 percent said that sales of standard progressives had decreased as a percentage of total lens sales over the last three years, respectively.
Seventy-nine percent prefer lens manufacturer brands over lab private labels for digital progressive lenses.
COMPUTER/OFFICE LENSES
Almost all retailers surveyed (91 percent) said they determine whether a patient should have computer lenses by their occupation/vocation as opposed to add power.
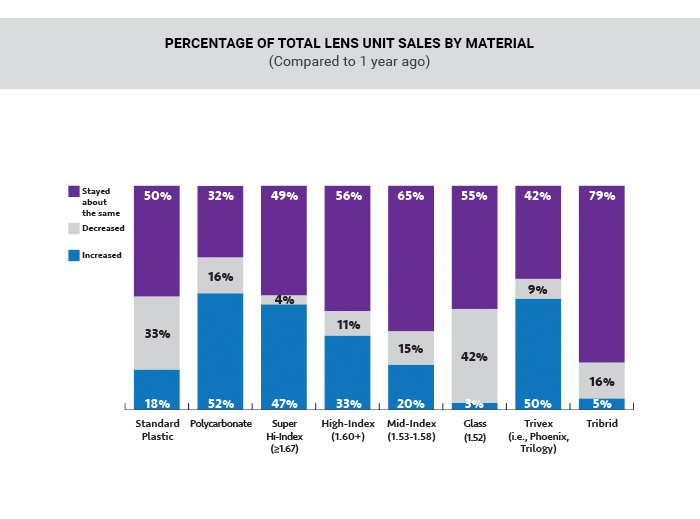
LENS MATERIALS
When asked to rank lens material by popularity, polycarbonate was ranked most popular by 53 percent of the retailers. Standard plastic was ranked most popular by 24 percent. Tribrid, the newest material, was ranked least popular by the most retailers (57 percent).
Fifty-two percent of retailers said their 2017 polycarbonate lens sales increased as a proportion of total lens pair sales compared to one year ago. Fifty percent and 47 percent said the same about their Trivex and super high-index lenses, respectively.
Sixty-five percent said that their mid-index lens sales had stayed flat. Glass was the weakest performer, with 42 percent saying that glass made up a smaller proportion of their total lens sales in 2017 than last year.
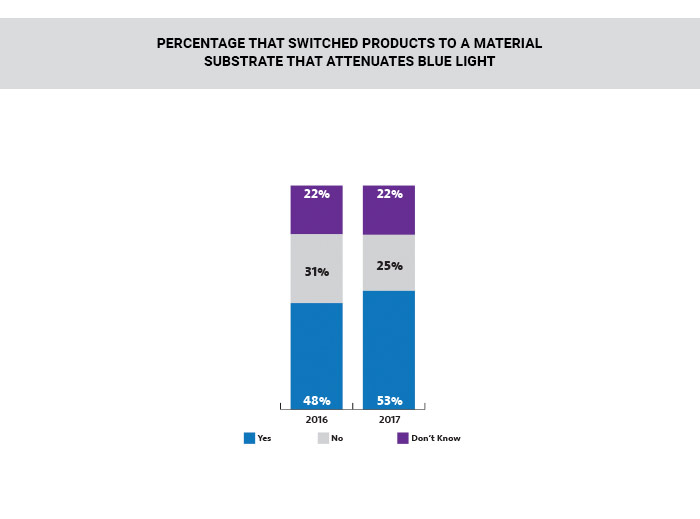
LENS TREATMENTS
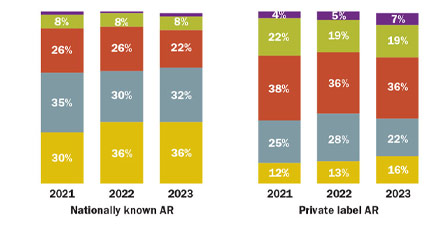
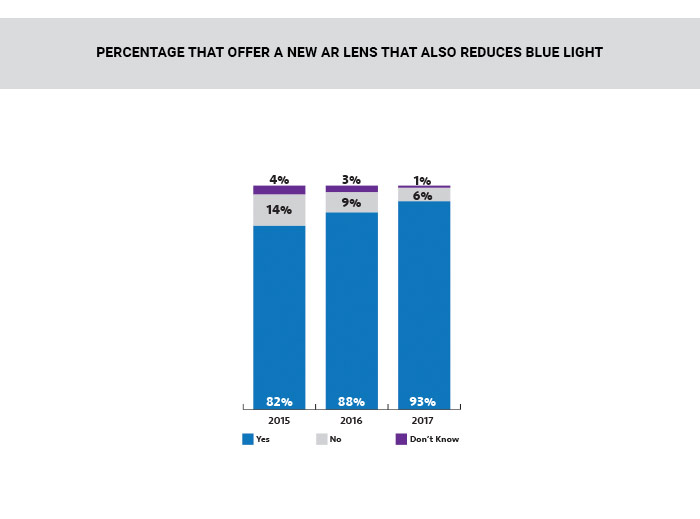
Ninty-three percent of retailers said they offer a new AR lens that also reduced blue light. Fifty-three percent switched some of the products to those where material substrate is instead attenuating blue light, citing it has replaced on average 23 percent of standard AR.
PERSONALIZED PROGRESSIVES
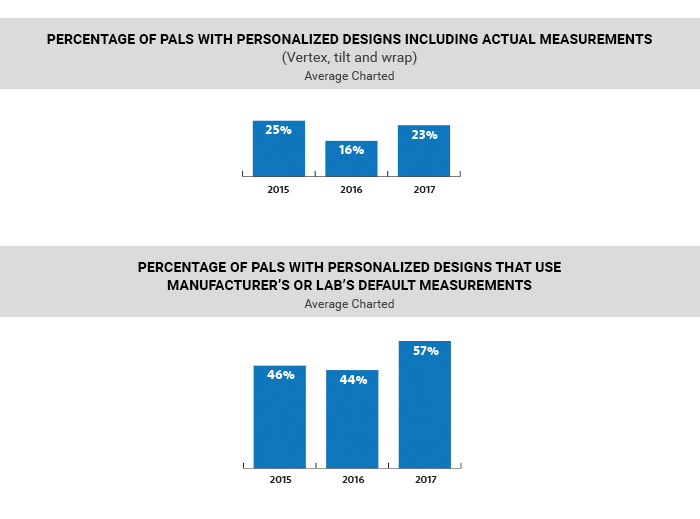
Retailers said that 43 percent of their progressive lens sales are personalized on average.
Twenty-three percent of the progressive lenses with personalized designs include actual vertex, tilt and wrap measurements.
Over half (57 percent) use the manufacturer’s or lab’s default measurements.
DIGITAL MEASURING DEVICES
Forty-eight percent of retailers said they have a digital measuring device in their office. Among them, 30 percent say they use it 75 percent to 100 percent of the time.
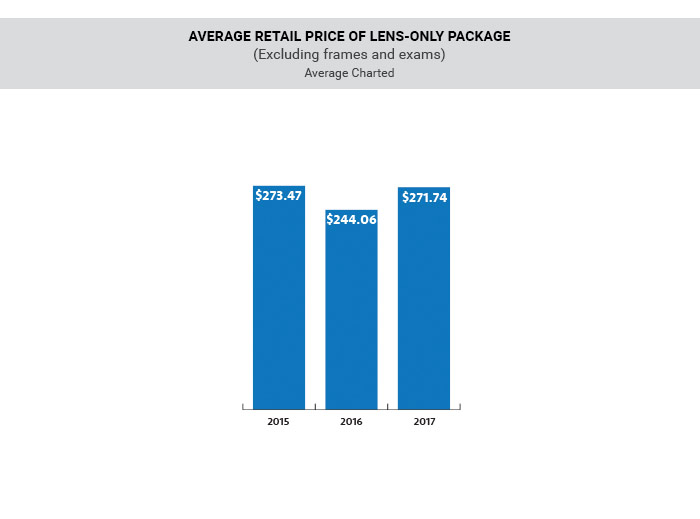
LENS PACKAGES
Forty-seven percent of retailers said they use package pricing. The average price of a lens-only package was $271.74.
OUTDOOR EYEWEAR
Sixty-five percent said they have increased discussions with their patients on the importance of UV and HEV-absorbing eyewear for outdoor use, and 50 percent have actually written more Rxs for them in the last three years.
METHODOLOGY
This sample was derived from the proprietary Jobson Optical Research database. This survey was conducted by Jobson Optical Research’s in-house research staff. Data collection was conducted in February 2018, asking about 2017 sales. Only the responses of independent optical retailers are included in the report. The 2018 sample consists of 251 independent optical retailers. All participants were recruited by e-mail, and the questionnaire was completed online. Three years of data is provided for comparisons where possible.
—Jennifer Waller, Research Director