


NEW YORK -- Recent growth in the U.S.
eyeglass market is predicted to continue throughout the year,
according to data from VisionWatch, a large scale continuous
research study conducted by the Vision Council of America (VCA) and
Jobson Optical Research. While growth in the first half of the year
was modest, the most recent “Eyeglass Future Purchase Intent
Index” signifies that more eyeglass wearers are looking to
buy new eyeglasses in the coming months.
Between October 2005 and March 2006, 26.1 percent of the American adult eyeglass wearing population (37.5 million people) indicated that they were either very likely or extremely likely to purchase a pair of prescription eyeglasses. This figure has been rising since June 2005 and should translate into higher sales in the third and fourth quarter of 2006.
|
| Source: Jobson Optical
Research-VCA/VisionWatch
Data for the 12 ME (months ending) March 2006. Contact Lens data is for the 6ME March 2006 *All retail includes dollars spent at all retail types at any retail location on the sale of either spectacle lenses, frames, contact lenses, sunglasses (plano and Rx), OTC readers, or revenue earned from refractive surgery or eye examinations. This number does not include sunglass clips and reflects the dollars spent only by those U.S. residents 18 and older. Does not include retail dollars spent by/for contact lenses and exams for those 17 years of age and younger. Inflation not taken into consideration. |
 |
| Source: Jobson Optical
Research-VCA/VisionWatch.
Total Annual VisionWatch Sample Size: 100,000 consumer respondents per year (US Adults 18+) Data for the 12 ME (months ending) March 2006. Contact Lens data is for the 6ME March 2006 *All retail includes dollars spent at all retail types at any retail location on the sale of either spectacle lenses, frames, contact lenses, sunglasses (plano and Rx), OTC readers, or revenue earned from refractive surgery or eye examinations. This number does not include sunglass clips and reflects the dollars spent only by those U.S. residents 18 and older. Does not include retail dollars spent by/for contact lenses and exams for those 17 years of age and younger. Inflation not taken into consideration. |
 |
| Source: Jobson Optical
Research-VCA/VisionWatch
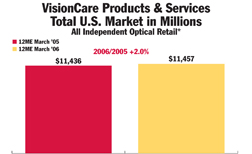
Total Annual VisionWatch Sample Size: 100,000 consumer respondents per year (US Adults 18+) Data for the 12 ME (months ending) March 2006. Contact Lens data is for the 6ME March 2006 *All Independent Optical Retail includes dollars spent at independent optical locations on either spectacle lenses, frames, contact lenses, sunglasses (plano and Rx), OTC readers, or revenue earned from refractive surgery or eye examinations. This number does not include sunglass clips and reflects the dollars spent only by those U.S. residents 18 and older. Does not include retail dollars spent by/for contact lenses and exams for those 17 years of age and younger. An independent optical location is a location with 3 doors or less that has either a MD, OD, Optician or Optical Retailer on site. Inflation not taken into consideration. |
 |
| Source: Jobson Optical
Research-VCA/VisionWatch
Total Annual VisionWatch Sample Size: 100,000 consumer respondents per year (US Adults 18+) Data for the 12 ME (months ending) March 2006. Contact Lens data is for the 6ME March 2006 *All Independent Optical Retail includes dollars spent at independent optical locations on either spectacle lenses, frames, contact lenses, sunglasses (plano and Rx), OTC readers, or revenue earned from refractive surgery or eye examinations. This number does not include sunglass clips and reflects the dollars spent only by those U.S. residents 18 and older. Does not include retail dollars spent by/for contact lenses and exams for those 17 years of age and younger. An independent optical location is a location with 3 doors or less that has either a MD, OD, Optician or Optical Retailer on site. Inflation not taken into consideration. |
|
| Source: Jobson Optical
Research-VCA/VisionWatch
Total Annual VisionWatch Sample Size: 100,000 consumer respondents per year (US Adults 18+) Data for the 12 ME (months ending) March 2006. Contact Lens data is for the 6ME March 2006 *All Independent Optical Retail includes dollars spent at independent optical locations on either spectacle lenses, frames, contact lenses, sunglasses (plano and Rx), OTC readers, or revenue earned from refractive surgery or eye examinations. This number does not include sunglass clips and reflects the dollars spent only by those U.S. residents 18 and older. Does not include retail dollars spent by/for contact lenses and exams for those 17 years of age and younger. An independent optical location is a location with 3 doors or less that has either a MD, OD, Optician or Optical Retailer on site. Inflation not taken into consideration. |
During the April 2005 to March 2006 time period, the eyeglass re-purchase cycle (the average amount of time between purchases of new pairs of prescription eyeglasses) was 2.2 years, a figure that remained stable since June 2005. However, the current “Eyeglass Future Purchase Intent Index” suggests that the eyeglass repurchase cycle may shrink in the near future as more and more eyeglass wearers have stated their intentions to buy a new pair of prescription eyeglasses in the coming months.
Unfortunately, high levels of purchase intent do not always correspond to increased sales and market activity. Intervening factors can arise from the time a person signifies their intent to make a purchase and the time they actually make that purchase. For example, in the summer and fall months of 2005, rising fuel prices and the string of devastating hurricanes hampered consumer confidence and purchasing intent. As a result, market activity and sales volume in the latter part of 2005 were flat despite previous high purchase intent among Americans that wear eyeglasses.
Even though 2006 has seen rising consumer confidence and economic growth, it’s important to keep a watch for any developments and events that might impact people’s intentions and hinder eyeglass purchases. In particular, some of the issues that might disrupt the American public’s eyeglass purchase plans would include worries about inflation, rising interest rates, the possibility of another destructive hurricane season or, as illustrated this summer, by world events.
By monitoring the types of products and devices that consumers are purchasing, ECPs and optical retailers can remain competitive, profitable and ensure that they are providing patients and customers with the products they want.
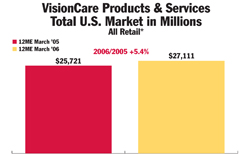
The vision care industry in the U.S. generated $27.11 billion in revenue between April 2005 and March 2006, an increase of 5.4 percent and a net increase of more than $1.4 billion from the previous year. This increase can be mainly attributed to growth in several areas of the optical market.
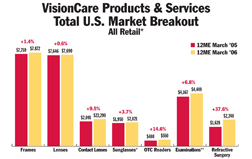
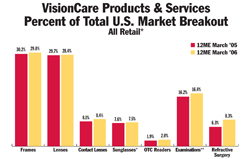
The strongest optical markets during this period were LASIK (+37.6 percent to $2.25 billion), over the counter readers (+14.6 percent to $550 million) and contact lenses (+9.6 percent to $2.29 billion). The frame (+1.4 percent to $7.87 billion) and lens (+0.6 percent to $7.69 billion) markets remained relatively flat with only minor growth from the previous year.
Although the frame market in the U.S. was relatively flat overall, there were certain sub-markets that experienced modest growth. When compared to the previous year, frames valued at more than $150 saw an 8.0 percent growth in unit sales and 7.4 percent growth in dollar value. More than 17.4 million pairs of frames worth more than $150 per pair were sold in the U.S. generating just under $3 billion in revenue.
By material composition, sales of metal frames increased modestly from April 2005 to March 2006 with unit sales of standard metal frames rising by 20 percent to 4.0 million pairs.
In terms of brand designation, unit sales of non-brand frames, private label frames and large-name “American” brand frames were flat between April 2005 and March 2006. Units sales of large-name “European and non-American” brand frames rose by 6.2 percent as American consumers purchased more than 13.3 million pairs of “European and non-American” branded frames.
Similar to the frame market, lens sales in the U.S. varied based on specific segments and styles. The U.S. market for single vision and multifocal lenses has been flat recently, while the market for PALs increased substantially. Between April 2005 and March 2006, more than 20.5 million pairs of PAL lenses worth $3.7 billion were sold in the U.S. When compared to the previous year, this represents growth of 5.1 percent in unit sales and growth of 3.2 percent in dollar revenue.
Another growth market was the photochromic lens market. A total of 10.9 million pairs of photochromic lenses were sold in the U.S. during this period of time (6.8 percent growth when compared to the previous year). These photochromic lens sales generated $1.40 billion in dollar sales, accounting for 18.2 percent of total lens market dollar value in the U.S.
Lenses with anti-reflective (AR) coating are the final major lens market to see significant growth recently. More than 16.2 million pairs of AR coated lenses, worth $2.25 billion, were sold in the U.S between April 2005 and March 2006. This means that 21.6 percent of all lenses sold in the U.S. possessed AR coating. When compared to figures from the previous year, unit shipments of AR coated lenses rose by 6.4 percent (a net increase of 1.0 million pairs of lenses), while dollar value surged by 7.3 percent (a gain of more than $153 million in additional sales).
(The data in this article was obtained from VisionWatch, a large scale continuous research study conducted by the Vision Council of America and Jobson Optical Research.)